
x = input('Enter first sequence');
y = input('enter second sequence');
z = conv(x,y);
disp(z);
c = cconv(x,y);
disp(c);
subplot(4,1,1);
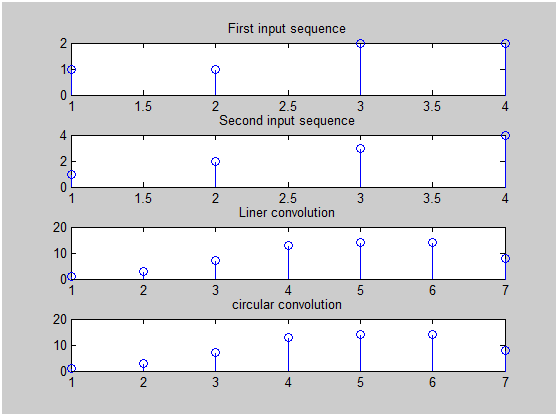
stem(x);
title('First input sequence');
subplot(4,1,2);
stem(y);
title('Second input sequence');
subplot(4,1,3);
stem(z);
title('Liner convolution');
subplot(4,1,4);
stem(c);
title('circular convolution');
Output
Enter first sequence[1 1 2 2]
enter second sequence[1 2 3 4]
     1     3     7    13    14    14     8

    1.0000    3.0000    7.0000   13.0000   14.0000   14.0000    8.0000
This article is really cool. I have bookmarked it. Do you
allow guest post on your website ? I can write high quality posts for you.
Let me know.