
Versions, and an honest limit. Spring Boot 4.1.1, Spring AI 2.0.1, Micrometer 1.17.1, OpenTelemetry 1.62.0, Prometheus 3.15.0, Grafana 13.2.3 and Java 25. All the code is in theobservabilitymodule of asmhatre/spring-ai, and every console block below is quoted from a file under itsoutput/directory. No real AI provider was called. The application uses the realOpenAiChatModeland the real OpenAI Java SDK, but pointed at a small local server I wrote that speaks the same HTTP protocol. So every meter name, tag, span and retry below is what Spring AI really produces. The token counts are only about characters divided by four, the latencies are the fake server’s, and the prices in the configuration are made-up examples, not anyone’s price list. This article is evidence about the instrumentation. It is not evidence about what any provider’s calls cost or how long they take.
Observability is three signals, and Spring AI feeds all of them
Three words come up all the time, so here they are in plain terms. A metric is a number that is sampled over time: tokens used per minute, or how many calls failed. It is cheap to store and good for dashboards and alerts, but it cannot tell you about one particular request. A trace is the story of one request: which steps ran, in what order, and how long each took. It is good for “why was this call slow”. A log is a line of text. Spring AI produces the first two directly, and logs only if you ask. Both come from one mechanism. Micrometer has an Observation: a named unit of work (a model call, a tool call) that you start and stop. Anything can listen. A listener that turns an observation into a timer gives you a metric; a listener that turns it into a span gives you a trace. Spring AI starts an observation around each piece of its work, so one instrumented call produces both signals with the same names and tags, and you can add a listener of your own, which section 4 does for cost.Going deeper: what you add to the project
Four dependencies turn this on:
spring-boot-starter-actuator, micrometer-registry-prometheus for the scrape endpoint, spring-boot-starter-opentelemetry for traces, and your Spring AI model starter. Property names for tracing and metrics export differ between Boot versions, so copy them from the application.yml that ran here rather than from an older tutorial (I checked each against the Boot 4.1.1 configuration metadata); management.tracing.export.otlp.enabled and management.otlp.metrics.export.enabled are the two on/off switches I used.
pom.xml— the exact dependencies.application.yml— the exact properties, with OTLP export off so the module runs offline.- Spring AI reference: Observability
What you get with no code at all
Start with a plain application: four endpoints that call aChatClient, one of them with a tool. AiController.java is the whole controller. I sent three requests (/ask, /weather, which makes one tool call, and /stream) and listed every meter whose name starts with gen_ai. or spring.ai., along with its type and tags (01-builtin-metrics.txt, from BuiltInMetricsTest.java):
gen_ai.client.operation            TIMER  [error, gen_ai.operation.name, gen_ai.request.model, gen_ai.response.model, gen_ai.system]
gen_ai.client.operation.active     LONG_TASK_TIMER  [gen_ai.operation.name, gen_ai.request.model, gen_ai.response.model, gen_ai.system]
gen_ai.client.token.usage          COUNTER  [gen_ai.operation.name, gen_ai.request.model, gen_ai.response.model, gen_ai.system, gen_ai.token.type]
spring.ai.advisor                  TIMER  [error, gen_ai.operation.name, gen_ai.system, spring.ai.advisor.name, spring.ai.kind]
spring.ai.advisor.active           LONG_TASK_TIMER  [gen_ai.operation.name, gen_ai.system, spring.ai.advisor.name, spring.ai.kind]
spring.ai.chat.client              TIMER  [app.endpoint, error, gen_ai.operation.name, gen_ai.system, spring.ai.chat.client.stream, spring.ai.kind]
spring.ai.chat.client.active       LONG_TASK_TIMER  [app.endpoint, gen_ai.operation.name, gen_ai.system, spring.ai.chat.client.stream, spring.ai.kind]
spring.ai.tool                     TIMER  [error, gen_ai.operation.name, gen_ai.system, spring.ai.kind, spring.ai.tool.definition.name, spring.ai.tool.type]
spring.ai.tool.active              LONG_TASK_TIMER  [gen_ai.operation.name, gen_ai.system, spring.ai.kind, spring.ai.tool.definition.name, spring.ai.tool.type]

model calls recorded (gen_ai.client.operation, error=none): 4
chat client calls recorded (spring.ai.chat.client): 3
tool executions recorded (spring.ai.tool): 1
tokens: input=24 output=29 total=53spring.ai.chat.client is one sample per ChatClient call, the thing your controller made. spring.ai.advisor is one per advisor in the chain. spring.ai.tool is one per tool execution. gen_ai.client.operation is one per call to the model itself. And gen_ai.client.token.usage counts tokens, tagged input, output or total. The last four lines of the block show how they relate: three user requests made four model calls, because the /weather request asked the model, ran a tool, then asked the model again.
Those are Micrometer names. Prometheus rewrites dots to underscores and adds suffixes, so the same meters look different when you query them. 09-prometheus-families.txt is the list as the scrape endpoint exposes it:
# TYPE app_ai_cost_usd_total counter
# TYPE app_ai_tokens_total counter
# TYPE app_ai_unpriced_total counter
# TYPE gen_ai_client_operation_active_seconds histogram
# TYPE gen_ai_client_operation_active_seconds_gcount gauge
# TYPE gen_ai_client_operation_active_seconds_gsum gauge
# TYPE gen_ai_client_operation_active_seconds_max gauge
# TYPE gen_ai_client_operation_seconds histogram
# TYPE gen_ai_client_operation_seconds_max gauge
# TYPE gen_ai_client_token_usage_total counter
# TYPE spring_ai_advisor_active_seconds summary
# TYPE spring_ai_advisor_active_seconds_max gauge
Two things to know before you chart these. First, in 2.0.1 the token meter is a counter (it ends in_total), not a distribution summary, so you chart it withrate()orincrease(). Second, the model timer carries the model name twice,gen_ai.request.model(what you asked for,gpt-4o-mini) andgen_ai.response.model(what answered, heregpt-4o-mini-2024-07-18). A provider that rolls a model alias forward changes the second one without any change in your code, which is useful to see and easy to break a price lookup with.
Going deeper: the meters I did not use, and what a tag costs
There is a long-task-timer twin (
.active) for every timer above; it counts calls in flight right now, which is what you want for “are we stuck”. The names and tags are the framework’s, which follow the OpenTelemetry gen_ai naming. The important property of a tag is cardinality: each distinct combination of tag values is a separate time series that Prometheus must store. gen_ai.response.model has a handful of values; a user id would have millions. Spring AI keeps high-cardinality data (the prompt, the response id) on the span and low-cardinality data on the meter, and so should anything you add.
BuiltInMetricsTest.java— asserts the meter set and the call counts above.- Spring AI 2.0 ChatClient on Spring Boot 4.1
Tracing a tool call: one request, a tree of spans
A metric tells you the average; a trace tells you about one slow request. In a chat application the interesting question is usually “why did this request take eight seconds”, and the answer is often that it made more model calls than you thought. I captured the spans for a singleGET /weather with an in-memory exporter and printed them as a tree (02-tool-call-spans.txt, from ToolCallSpansTest.java):
http get /weather  [SERVER]
  spring_ai chat_client  [INTERNAL]
    tool _calling   [INTERNAL]
      call  [INTERNAL]
        chat gpt-4o-mini  [INTERNAL]
          POST  [CLIENT]
      execute_tool getWeather  [INTERNAL]
      call  [INTERNAL]
        chat gpt-4o-mini  [INTERNAL]
POST [CLIENT]ChatClient call. Inside, a loop alternates model calls and tool executions; the tool sits between two model calls, which is why a request with N tool rounds has N+1 model calls and N+1 outgoing HTTP requests. That is what to look for in a slow trace. The span named tool _calling (with the odd spacing, copied exactly) is the tool-calling loop, the same one covered in the tool calling article.
The model-call spans carry the token counts as attributes, and the keys are in the second half of the transcript: gen_ai.usage.input_tokens, output_tokens, total_tokens, and spring.ai.model.request.tool.names. So one trace shows both how long and how many tokens for each step, which a metric aggregated across requests cannot.
Going deeper: sending traces somewhere
The module keeps OTLP export off so it runs without a collector. To ship spans, set
management.tracing.export.otlp.enabled=true and point management.opentelemetry.tracing.export.otlp.endpoint at your collector or at a backend such as Tempo or Jaeger. management.tracing.sampling.probability controls what share of requests are traced; I set it to 1.0 so every test request is recorded, and a busy production service usually wants much less. I verified the span tree with an in-memory exporter, not by looking at a real tracing backend, so how the tree is drawn in Tempo or Jaeger is not something I tested.
ToolCallSpansTest.java— builds the tree; it waits for the server span, which ends after the response is written and so can arrive a moment later than the test thread expects.TestObs.java— the in-memory exporter wiring.- OpenTelemetry GenAI semantic conventions
Cost per endpoint: add one tag and one listener
The built-in meters stop at tokens. They do not know what a token costs, because prices change and differ per provider, and they do not know which of your endpoints spent them. Both are small additions, and both matter: a bill you cannot attribute is a bill nobody owns. First, the endpoint. Each controller method puts a name in the request’s context (AiController.java), and a custom observation convention copies it onto the chat client’s meter as a tag. EndpointTagConvention.java is the whole thing:
public class EndpointTagConvention extends DefaultChatClientObservationConvention {

    public static final String KEY = "endpoint";

    @Override
    public KeyValues getLowCardinalityKeyValues(ChatClientObservationContext context) {
        Object endpoint = context.getRequest().context().get(KEY);
        return super.getLowCardinalityKeyValues(context).and(KeyValue.of("app.endpoint", endpoint == null ? "none" : endpoint.toString()));
    }
}UsageCostObservationHandler.java is an observation listener. When a chat client call finishes it reads the token usage off the response and increments three counters: tokens and cost, both tagged by endpoint and model, and a counter for calls it could not price. The prices are configuration, in Pricing.java, because they change and are not code. This is the heart of it:
    public void onStop(ChatClientObservationContext context) {
        String endpoint = String.valueOf(context.getRequest().context().getOrDefault(EndpointTagConvention.KEY, "none"));
        ChatClientResponse response = context.getResponse();
        ChatResponse chat = response == null ? null : response.chatResponse();
        Usage usage = chat == null || chat.getMetadata() == null ? null : chat.getMetadata().getUsage();
        String model = chat == null || chat.getMetadata() == null ? null : chat.getMetadata().getModel();
        Pricing.Price price = pricing.forModel(model);
        boolean noUsage = usage == null || usage.getPromptTokens() == null || usage.getPromptTokens() == 0;
        if (noUsage || price == null) {
            Counter.builder("app.ai.unpriced").tag("endpoint", endpoint).tag("reason", noUsage ? "no-usage" : "no-price")
                    .register(registry).increment();
            return;
        }
        long in = usage.getPromptTokens();
        long out = usage.getCompletionTokens() == null ? 0 : usage.getCompletionTokens();
        Counter.builder("app.ai.tokens").tag("endpoint", endpoint).tag("model", model).tag("type", "input").register(registry).increment(in);
        Counter.builder("app.ai.tokens").tag("endpoint", endpoint).tag("model", model).tag("type", "output").register(registry).increment(out);
        Counter.builder("app.ai.cost.usd").tag("endpoint", endpoint).tag("model", model).baseUnit("usd").register(registry)
                .increment(in * price.inputPerMillion() / 1_000_000d + out * price.outputPerMillion() / 1_000_000d);
}03-cost-per-endpoint.txt (from CostPerEndpointTest.java), with prices of 0.15 USD per million input tokens and 0.60 per million output, which are examples I chose:
endpoint      input   output       cost USD
ask               1        4     0.00000255
summarize       511       13     0.00008445
weather          19       18     0.00001365

framework model-level tokens: input=531 output=35
our per-endpoint tokens     : input=531 output=35
total cost USD: 0.00010065summarize costs 33 times what ask does, and the reason is in the input column: 511 tokens in against 1. The dashboard in section 6 makes that gap visible at a glance, which is the entire reason to tag by endpoint. The last two lines of the block are a cross-check: the sum of our per-endpoint tokens (531 in, 35 out) equals the framework’s own model-level total. If they ever disagree, the handler is wrong, not the framework.
Keep the endpoint tag a short, fixed list. It is a metric tag, so every distinct value becomes a time series. An endpoint name or a feature name is fine. A user id, a conversation id or a prompt is not: it would create a new series per value, grow Prometheus without bound, and make every query slow. If you need cost per user, put the user id on the span, or aggregate it in a database, not on the meter.
Going deeper: why a longest-prefix price lookup
The response model is
gpt-4o-mini-2024-07-18, a dated snapshot, while the price table says gpt-4o-mini. Pricing.java picks the longest configured prefix, so the snapshot matches the mini entry and not the shorter gpt-4o. A model with no entry is counted under app.ai.unpriced{reason=no-price} and not charged zero. Prices live in application.yml under ai.pricing.models; the numbers there are labelled as examples, so replace them from your provider’s price page before you trust a figure in dollars. Cached or discounted input tokens, batch pricing and per-image charges are not modelled here at all.
ObservabilityConfig.java— registering the convention and the handler as beans is all the wiring there is.CostPerEndpointTest.java— asserts the figures and the cross-check.- Custom advisors in Spring AI 2.0 — the other way to hook the call, and the right one when you want to refuse over budget rather than only count.
When the numbers lie: free calls, streams and failures
A cost dashboard is only as good as its worst gap, and three gaps look exactly like good news. The first is the quietest. If a provider (or a proxy, or a local model) does not return a usage block, the framework does not give you null. It gives you a usage of zero tokens, so the call looks free and your token counter stays flat. I sent two calls to a server that omits usage, one plain and one streamed (04-streaming-usage.txt, from StreamingUsageTest.java):
stream request body asks for usage (stream_options.include_usage): true
request fragment: "stream":true

two calls to a server that omits the usage block (/ask and /stream):
  gen_ai.client.token.usage total, before 7 -> after 7
  app.ai.unpriced{reason=no-usage} for ask   : 1
app.ai.unpriced{reason=no-usage} for stream: 1stream_options.include_usage; Spring AI does, and the stream’s final chunk then carries the counts, which are counted like any other. The last three lines are the trap: the framework’s token total stayed at 7 across two calls. That is why the handler treats a prompt-token count of zero as “no usage” (a real call always has at least one) and counts it under app.ai.unpriced instead of silently adding zero. A non-zero unpriced series is the alarm: your cost figure is a floor, not a total.
The second gap is failure. I pointed the app at a server that always answers HTTP 500 and made one user request (05-error-and-retry.txt, from ErrorAndRetryTest.java):
HTTP requests the provider received for that one call: 4
model-call timers recorded:
  error=InternalServerException  response.model=none                     count=1
chat-client timers with an error: 1
app.ai.unpriced{endpoint=ask,reason=no-usage}: 1
app.ai.cost.usd recorded for the failed call: 0error=InternalServerException and a response model of none, and the cost recorded is zero. Two lessons. The error counter understates the load you put on the provider, and a provider that bills failed requests, or rate-limits them, sees four. And the latency you see on the dashboard for a failing dependency is the retries’ total, not one attempt.
What a healthy cost chart cannot tell you. It cannot tell you a call was skipped (you never made it), cached (no tokens, but no cost either, which is correct), or unpriced (the model name is missing from the table). The unpriced counter exists to separate the last from the first two. Chart it next to cost and alert on it being non-zero.
Going deeper: the retry setting, and one more place usage can vanish
The retry count comes from the OpenAI SDK’s default client, not from Spring AI; Spring AI exposes it as
spring.ai.openai.max-retries (I confirmed the property exists in the 2.0.1 metadata but did not run with a different value), so presumably zero makes a failure cost one request. Spring Boot’s own HTTP client observations (the POST [CLIENT] span in section 3) show each attempt separately, which is how I confirmed four. A fourth place usage can disappear is a custom ChatModel or proxy that does not copy provider usage into the response metadata; the handler treats that as no-usage too. Failed calls are lumped under the same reason as no-usage in this module, which is simple but coarse: split them with the error tag if you need the difference.
ErrorAndRetryTest.java— counts the requests the fake server received.FakeOpenAiServer.java— the fake; keywords in a prompt (slow,boom,nousage) steer its behaviour.
The Grafana dashboard, and why latency needs a flag
With the counters in place, the dashboard is queries. I ran Prometheus 3.15.0 and Grafana 13.2.3 from their release tarballs, no Docker, withstack-up.sh starting everything and load.sh generating mixed traffic (normal calls, slow ones, failures, no-usage replies). Grafana loads the dashboard from spring-ai-observability.json, which a short script, make-dashboard.py, generates. This is how it rendered:
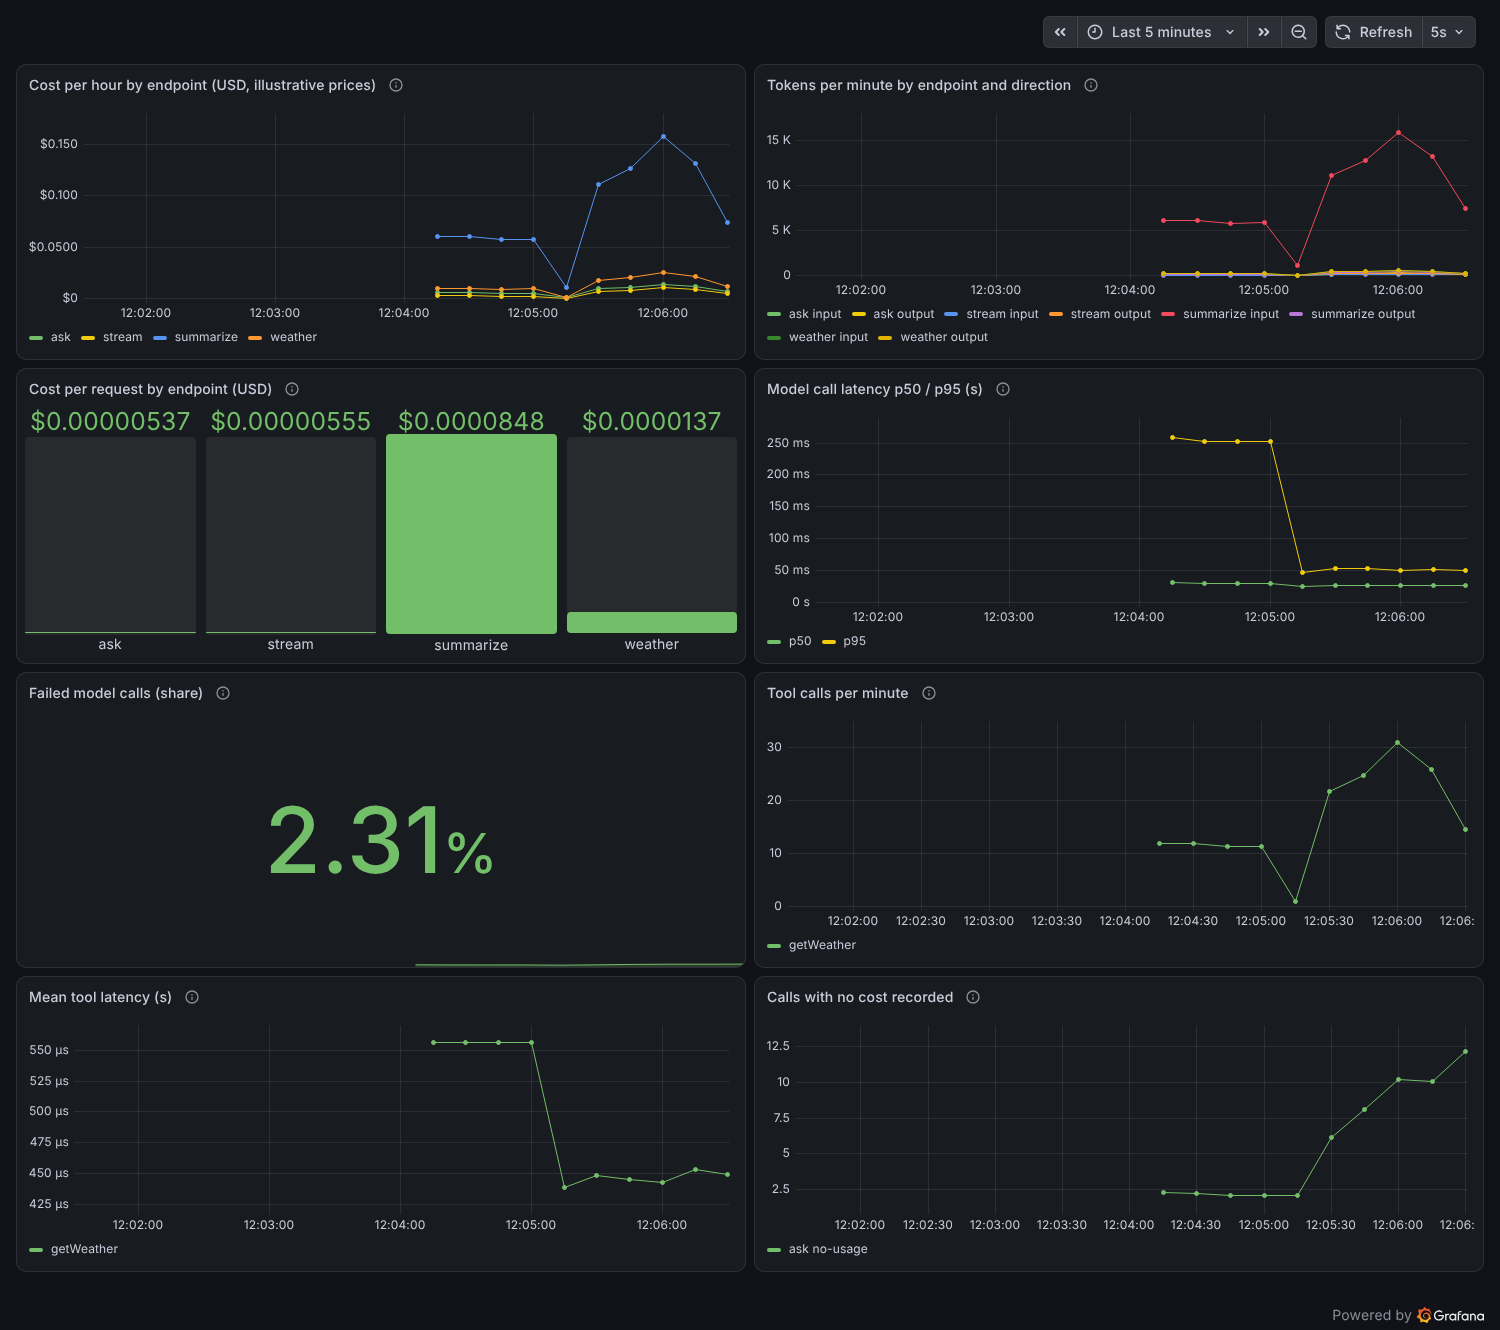
summarize is the outlier. Latency is the right-hand middle panel, errors and tool use below. The panel at the bottom right is the one to leave on: calls with no cost recorded.
A screenshot proves it rendered, not that the panels are right. So a script runs every query twice, once straight at Prometheus and once through Grafana’s own query API, with the provisioned data source, which is what a panel does. A query that returns nothing is a broken panel. This is the result (08-dashboard-queries.txt, from verify-dashboard.py):
panel                                                      prom series grafana frames
Cost per hour by endpoint (USD, illustrative pri [A]                 4              4
Tokens per minute by endpoint and direction [A]                      8              8
Cost per request by endpoint (USD) [A]                               4              4
Model call latency p50 / p95 (s) [A]                                 1              1
Model call latency p50 / p95 (s) [B]                                 1              1
Failed model calls (share) [A]                                       1              1
Tool calls per minute [A]                                            1              1
Mean tool latency (s) [A]                                            1              1
Calls with no cost recorded [A] 1 1histogram_quantile(), which needs buckets, and Micrometer does not record them by default. I started the app twice and counted the bucket series for the model timer (07-histogram.txt, from HistogramTest.java):
setting                                                                _bucket series / _sum series
defaults                                                               0 / 1
percentiles-histogram.gen_ai.client.operation=true                     69 / 1

first bucket series when enabled: gen_ai_client_operation_seconds_bucket{le="0.001"}management.metrics.distribution.percentiles-histogram.gen_ai.client.operation=true turns them on, and the number to notice is the cost: 69 bucket series per label combination. Multiply that by models, errors and any tag you add, and a histogram is the most expensive meter you own. The module therefore sets it only in the stack profile, application-stack.yml, and narrows the expected range there to 50 ms–30 s. Here are the two queries that matter most:
    ("Model call latency p50 / p95 (s)", "timeseries", "s",
     [("histogram_quantile(0.50, sum by (le) (rate(gen_ai_client_operation_seconds_bucket{error=\"none\"}[1m])))", "p50"),
      ("histogram_quantile(0.95, sum by (le) (rate(gen_ai_client_operation_seconds_bucket{error=\"none\"}[1m])))", "p95")],
     "gen_ai.client.operation, one sample per HTTP call to the provider. Needs the percentiles-histogram property."),
The dashboard is checked against a fake provider. The shapes are real, the values are not. The 250 ms latency on the slow requests and the 2.2 percent failure share in the screenshot come from keywords in my test traffic, and the dollar figures use made-up prices. Treat it as a working template, then look at your own numbers.
Going deeper: PromQL for rate versus increase, and the label rename
rate(x[1m]) * 3600 is a per-second rate scaled to an hourly figure; increase(x[5m]) is the actual growth over a window, which is the better choice for “cost per request” because both sides are totals over the same five minutes. The cost-per-request panel divides a metric tagged endpoint (ours) by one tagged app_endpoint (the framework’s chat client meter, after Prometheus renames app.endpoint), so it renames one label with label_replace before dividing. A rate over a short window needs at least two scrapes inside it, so the demo scrapes every two seconds; a production scrape interval of 15 to 60 seconds wants windows of several minutes.
make-dashboard.py— every panel and query in one list.prometheus.ymlandprom.yml— the whole Prometheus and Grafana setup.- Prometheus: histograms and summaries
Prompts in telemetry: off by default, and one switch away
One more thing observability can do is leak. A trace or a log that contains the prompt contains whatever the user typed: a name, an account number, a medical question. Spring AI keeps the prompt out of telemetry unless you opt in. I tested that with a recognisable string,ticket-4711-card-ending-0042, as the user’s question, then searched logs, span attributes and span events with prompt logging off and on (06-prompt-content.txt, from PromptContentTest.java):
setting                                                        log lines with it / span attributes with it / span events with it
defaults                                                       0 / 0 / 0
spring.ai.chat.observations.log-prompt=true (+ client)         1 / 0 / 0

span attributes carrying the text when enabled: []spring.ai.chat.observations.log-prompt=true (and the matching chat client property) it appears in one log line, and still not as a span attribute or event in this version. Start-up also logs a warning that you have turned it on. Two practical points follow. The log line is written with the current trace id, so it can be found from a trace, and it goes to wherever your logs go, with whatever retention that has. And the completion has its own separate switch, so enabling one does not enable the other.
Switch it on in a test environment, not in production. It is useful for seeing what the model actually received. But a prompt in a log is personal data in a log, with the retention, access and deletion duties that carries. If you need it in production, redact first, with an advisor, before the observation is recorded.
Going deeper: where the prompt shows up, and how I tested it
The test starts the whole application twice with
SpringApplicationBuilder and passes the properties as command-line arguments, which outrank the values in application.yml; passing them as the builder’s default properties does not, and my first attempt silently used the wrong server. It attaches the log appender after the context has started, because Spring Boot reconfigures logging during start-up and drops an appender added earlier. The related switches are spring.ai.chat.observations.log-completion, spring.ai.chat.client.observations.log-prompt and spring.ai.tools.observations.include-content (tool arguments and results).
PromptContentTest.java— the experiment.- Custom advisors: PII redaction — redact before telemetry sees it.
Should you even do this?
Yes, and the cheap version first. Add the actuator and Prometheus dependencies, expose the scrape endpoint, and chart gen_ai.client.token.usage and the model timer. That is an afternoon, it costs nothing in code, and it answers most “why did this get expensive” questions. Add the endpoint tag and the cost handler when more than one feature shares a model. Add traces when you have a slow request you cannot explain, and the histograms only for the timers you will alert on. Do not put user ids on a meter, do not turn on prompt logging in production, and do not treat a dollar figure computed from a price table as an invoice: reconcile it against your provider’s billing at least once. What this article did not test: any real provider’s token counts, latency or error behaviour, a real tracing backend, OTLP metric export, cached-token and batch pricing, multi-instance aggregation, and the cost of running this much instrumentation under real load.
Further reading
- The code for this article: the
observabilitymodule of asmhatre/spring-ai, with all the transcripts underoutput/and its README. - Tool calling in Spring AI 2.0 — the loop the span tree shows.
- Custom advisors: logging, PII redaction and token budgets — act on usage, not just count it.
- Structured output in Spring AI 2.0 and chat memory — both change how many tokens each call carries.
- Testing LLM apps in Java — the same stub-and-fake-server approach to keep tests free.
- Spring AI 2.0 ChatClient on Spring Boot 4.1 and running models locally with Ollama, where usage reporting can differ.
- Testing asynchronous code with Awaitility — for assertions on spans that finish after the response.
- Spring AI reference: Observability, Micrometer Observation and OpenTelemetry GenAI conventions
- Prometheus querying and Grafana provisioning
No Comments yet!