
As Java developers, we are blessed with one of the most sophisticated features a programming platform can offer: automatic memory management. We don’t have to manually allocate and deallocate memory like our C++ brethren, which saves us from a whole class of painful bugs. This “magic” is handled by the Java Virtual Machine (JVM) and its Garbage Collector (GC).
But here’s the thing: relying on magic without understanding it can lead to trouble. The dreaded OutOfMemoryError, mysterious performance slowdowns, and long application pauses can all be symptoms of memory management woes. To truly master Java, you need to peek behind the curtain.
In this post, we’ll demystify how the JVM manages memory and how the Garbage Collector works its magic to keep our applications running smoothly.
The JVM’s Memory Blueprint: Where Everything Lives
When you start a Java application, the JVM carves out a chunk of memory from the operating system. This memory isn’t just one big, messy pile; it’s a highly organized space, divided into several key areas. While there are a few, we’ll focus on the two most relevant to our day-to-day coding: the Stack and the Heap.
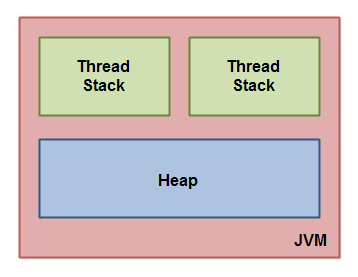
https://jenkov.com/tutorials/java-concurrency/java-memory-model.html
A simplified view of where our data goes.
1. The Stack: The Sprint Runner
Think of the Stack as a super-fast, last-in-first-out (LIFO) workspace for each thread. Every time a thread invokes a method, a new “stack frame” is pushed onto its personal stack.
- What lives here? Local primitive variables (
int,double,boolean) and references (pointers) to objects on the Heap. - Lifecycle: A stack frame is created when a method is called and is destroyed the moment the method completes. It’s fast, efficient, and self-cleaning.
- Key takeaway: Memory on the stack is short-lived and tied to method scope. This is why a variable declared inside a method is gone once the method returns.
public void myMethod() {
    int localValue = 10; // Stored directly on the stack for this method's frame
    String message = "Hello"; // The *reference* 'message' is on the stack...
    // ...but the actual String object "Hello" is created on the Heap.
} // When this method ends, the stack frame is popped. 'localValue' and 'message' are gone.
2. The Heap: The Object Playground
The Heap is the main event. It’s the JVM’s shared memory area where all objects and arrays are created. If you use the new keyword, that object is born on the Heap.
- What lives here? All objects (instances of classes), including their instance variables, and arrays.
- Lifecycle: Objects on the Heap live on even after the method that created them has finished. They persist as long as they are being referenced by something.
- Key takeaway: This is where the Garbage Collector does its work. Since objects aren’t automatically cleaned up when a method ends, the GC’s job is to find and remove the ones that are no longer needed.
A Closer Look at the Heap: Generational Garbage Collection
To make garbage collection more efficient, the JVM architects made a brilliant observation, known as the Weak Generational Hypothesis:
- Most objects die young.
- The few objects that survive for a while tend to stick around for a long time.
Based on this, the Heap is divided into two main generations:
- The Young Generation: This is where all new objects are born. It’s further divided into:
- Eden Space: The entry point for all new objects. It’s usually the largest part of the Young Generation.
- Survivor Spaces (S0 and S1): Two smaller, equal-sized spaces. Objects that survive a garbage collection cycle in Eden are moved to one of the survivor spaces.
- The Old (or Tenured) Generation: This is the retirement home for long-lived objects. If an object survives enough GC cycles in the Young Generation, it gets “promoted” to the Old Generation.
This generational structure allows the GC to focus its efforts on the Young Generation, where most of the “garbage” is likely to be, making collections faster and less disruptive.
The Main Event: How the Garbage Collector Works
So, we have this pile of objects on the Heap. How does the GC figure out which ones to delete? The core process, in its simplest form, follows a three-step dance: Mark, Sweep, and Compact.
Step 1: Mark
The GC starts from a set of known, always-alive references called GC Roots. These include:
- Active threads.
- Local variables and parameters of the currently executing methods (i.e., on the stacks).
- Static variables from loaded classes.
- JNI references.
The GC traverses the entire object graph, starting from these roots, and “marks” every object it can reach as being alive.
public class GcExample {
    public static MyObject staticObj; // A GC Root (static variable)

    public void run() {
        MyObject localObj = new MyObject("A"); // A GC Root (local variable)
        staticObj = new MyObject("B");

        localObj.child = new MyObject("C"); // 'C' is reachable from 'A'

        MyObject unreachable = new MyObject("D"); // This object is not referenced by anything. It's garbage.

        // At this point:
        // 'A' is reachable via 'localObj'.
        // 'B' is reachable via 'staticObj'.
        // 'C' is reachable via 'localObj.child'.
        // 'D' is unreachable. It will be collected.
    }
}
Step 2: Sweep
After the marking phase, the GC sweeps through the Heap. Any object that was not marked as “alive” is now considered garbage. The memory occupied by these objects is reclaimed.
Step 3: Compact (Optional)
Simply sweeping leaves the memory fragmented, with empty spaces scattered between live objects. This can make it difficult to allocate large new objects. To solve this, some GCs perform a compaction phase, where they move all the live objects together, eliminating fragmentation and creating a large, contiguous block of free memory.
Meet the Collectors: A Cast of Characters
The JVM doesn’t have just one garbage collector; it has several, each designed for different use cases. Here are the most important ones:
1. The Serial GC
A single-threaded, “stop-the-world” collector. When it runs, it freezes the entire application. It’s simple and efficient for small applications with small heaps, but not suitable for server-side applications.
2. The Parallel GC (Throughput Collector)
The default GC in Java 8. It’s also a “stop-the-world” collector, but it uses multiple threads to perform the collection, making it much faster. It’s optimized for high application throughput (i.e., getting lots of work done), but the pause times can still be noticeable.
3. The G1 GC (Garbage-First)
The default GC since Java 9. G1 is a game-changer. It divides the heap into a large number of small regions. It tries to meet a user-defined pause time goal by collecting the regions with the most garbage first (hence the name). It’s a fantastic all-rounder that balances throughput and low pause times, making it suitable for most modern server applications.
4. The Future: ZGC and Shenandoah
These are ultra-low-latency collectors designed for applications with massive heaps (multi-terabyte) that cannot tolerate pauses of more than a few milliseconds. They perform almost all their work concurrently with the application, resulting in incredibly short, non-disruptive pauses.
Practical Advice: How to Be a Good Java Citizen
While the GC is smart, you can still cause problems with bad code. Here are some tips to help the GC, not hinder it.
1. Forget System.gc() Exists
Calling System.gc() is merely a suggestion to the JVM to run the garbage collector. The JVM is free to ignore it. A poorly timed call can trigger a full, expensive GC cycle when it’s not needed, causing unnecessary performance degradation. Trust the JVM; it knows when to collect garbage far better than you do.
2. Beware the finalize() Trap
Java has a finalize() method that gets called on an object before it’s garbage collected. It sounds like a useful place to clean up resources, right? Wrong.
Finalization is unpredictable, can delay garbage collection, and has been deprecated since Java 9 for good reason. For resource cleanup (files, sockets, database connections), always use the try-with-resources statement, which is deterministic and safe.
// The correct, modern way to handle resources.
// The FileInputStream will be closed automatically, no matter what.
try (FileInputStream fis = new FileInputStream("my-file.txt")) {
    // ... work with the file ...
} catch (IOException e) {
    // ... handle exception ...
}
3. Scope Your Variables Correctly
The best way to manage memory is to not hold onto it unnecessarily. Keep the scope of your variables as tight as possible. If an object is only needed inside a loop, declare it inside the loop. Once it goes out of scope, it becomes eligible for garbage collection.
A classic memory leak in Java is a long-lived collection (like a static Map) that you keep adding to but never remove from. The objects in that map will never be collected.
Conclusion
Java’s automatic memory management is a powerful tool, but it’s not a black box. Understanding the roles of the Stack and Heap, the generational hypothesis, and the “Mark, Sweep, Compact” process gives you the knowledge to write better, more performant, and more stable applications.
You don’t need to be a GC tuning expert for every project, but knowing the fundamentals helps you diagnose problems when they arise and write code that works with the system, not against it. So next time your application runs smoothly, take a moment to thank the tireless, unsung hero working behind the scenes: the Garbage Collector.
No Comments yet!