
The dashboards broke the same week I upgraded to Spring Boot 4. Not loudly — the app started fine, the health endpoint was green — but our Grafana board slowly went blank, panel by panel, over about twenty minutes. It took me an afternoon to figure out why: I had a hand-rolled MeterRegistry bean left over from a Boot 2 migration three years ago, and Boot 4’s new observability stack quietly stopped wiring itself around it the way Boot 3 used to.
That afternoon is the reason this guide exists. Spring Boot 4 did not just bump a version number on Micrometer — it introduced an entirely new, officially-supported way to ship metrics, traces, and logs out of your application: the spring-boot-starter-opentelemetry starter, built by the Spring team themselves and released alongside Boot 4.0 on 20 November 2025. If you have not touched your observability setup since Boot 3, there is a real chance it is running on borrowed time.
This is a start-to-finish guide. If you have never used Micrometer, start at the top and you will have a working mental model in ten minutes. If you already run Micrometer in production and just need to know what changed in Boot 4 and how to migrate, jump straight to what changed. Every section builds on the one before it, and I link back explicitly so you can follow the thread even if you skip around.
Where this guide is going
Ten sections, beginner to advanced, each one assuming only what the previous section taught you:
- 1. What Micrometer actually is — the vocabulary:
MeterRegistry,Counter,Timer,Gauge. Runnable, dependency-free-to-reason-about example. - 2. Micrometer inside a plain Spring Boot app — how autoconfiguration wires it up, and what
/actuator/prometheusactually returns. - 3. What changed in Spring Boot 4 — the three ways to get OpenTelemetry into a Spring app, and why the Spring team built a fourth.
- 4. Migrating to the OpenTelemetry starter — the dependency and property diff, step by step.
- 5. The Observation API — one recording, two signals: a metric and a trace span from the same code.
- 6. Context propagation gotchas — the
new RestTemplate()mistake,@Async, and lost trace IDs. - 7. Cardinality: the silent killer — a real, runnable demonstration of how one bad tag takes down a metrics backend.
- 8. Exporting logs over OTLP — the one signal Boot 4 does not wire up for you automatically.
- 9. The migration checklist
- 10. An AI prompt to audit your own observability setup
| Spring Boot 3 | Spring Boot 4 | |
|---|---|---|
| Registry dependency | micrometer-registry-prometheus (or another per-vendor jar) | micrometer-registry-otlp, bundled via spring-boot-starter-opentelemetry |
| Tracing bridge | micrometer-tracing-bridge-brave (or another vendor bridge) | micrometer-tracing-bridge-otel, bundled together |
| Export model | Pull — a scraper polls /actuator/prometheus | Push — metrics and traces POST to an OTLP endpoint |
| Wire format | Registry-specific (Prometheus text format, etc.) | One vendor-neutral format: OTLP |
What Micrometer actually is
Micrometer is to metrics what SLF4J is to logging: a single, vendor-neutral API in your code, with a pluggable backend underneath. You write counter.increment() once; whether that number ends up in Prometheus, Datadog, CloudWatch, or an OTLP collector is a dependency choice, not a code change. That one idea explains almost every design decision in the library.
There are three meter types you will use constantly, and a fourth you will use occasionally:
- Counter — a number that only goes up (requests served, errors thrown, orders placed).
- Timer — counts and times an operation in one object (request latency, query duration).
- Gauge — a number that goes up and down, sampled on demand (queue depth, active connections, cache size).
- DistributionSummary — like a Timer but for non-time values (payload size, batch length).
Everything is registered against a MeterRegistry, and every meter has an Id: a name plus a set of key/value tags. The tags are what make Micrometer dimensional — http.requests{method=GET,status=200} and http.requests{method=POST,status=500} are two separate time series sharing one metric name. Keep that in mind; it comes back with a vengeance in the cardinality section later on.
Here is the whole vocabulary in one runnable file. It uses SimpleMeterRegistry, the in-memory registry Micrometer ships specifically for tests and for exactly this kind of demonstration — no Prometheus, no OTLP collector, no network required:
import io.micrometer.core.instrument.Counter;
import io.micrometer.core.instrument.MeterRegistry;
import io.micrometer.core.instrument.Timer;
import io.micrometer.core.instrument.simple.SimpleMeterRegistry;
import java.util.concurrent.TimeUnit;

public class MicrometerBasics {

    public static void main(String[] args) throws InterruptedException {
        MeterRegistry registry = new SimpleMeterRegistry();

        Counter ordersPlaced = Counter.builder("orders.placed")
                .description("Number of orders placed")
                .tag("channel", "web")
                .register(registry);

        Timer orderProcessing = Timer.builder("orders.processing.time")
                .description("Time to process an order")
                .register(registry);

        // Simulate three orders coming in.
        for (int i = 0; i < 3; i++) {
            ordersPlaced.increment();
            orderProcessing.record(() -> {
                try {
                    Thread.sleep(50);
                } catch (InterruptedException e) {
                    Thread.currentThread().interrupt();
                }
            });
        }

        System.out.println("orders.placed count = " + ordersPlaced.count());
        System.out.println("orders.processing.time count = " + orderProcessing.count());
        System.out.printf("orders.processing.time mean  = %.1fms%n",
                orderProcessing.mean(TimeUnit.MILLISECONDS));
    }
}
Run that with the Micrometer core jar on your classpath and you get exactly what you would expect — a count and a mean duration, computed for you:
orders.placed count = 3.0
orders.processing.time count = 3
orders.processing.time mean  = 50.3ms
Notice what you did not do: pick a metrics backend, format a wire protocol, or manage a background export thread. That is the whole point of the facade. Now let’s see who does that work for you in a real application — Spring Boot’s autoconfiguration.
Micrometer inside a plain Spring Boot app
In the previous section you built a MeterRegistry by hand. Add spring-boot-starter-actuator to a Spring Boot project and Boot does that wiring for you: it creates a MeterRegistry bean, auto-registers dozens of JVM and system meters (heap usage, thread counts, GC pauses, uptime), and instruments your HTTP endpoints automatically. You do not call new SimpleMeterRegistry() anywhere — you @Autowired MeterRegistry registry and start recording your own business metrics next to the ones Boot already gives you.
@RestController
class OrderController {

    private final Counter ordersPlaced;

    OrderController(MeterRegistry registry) {
        this.ordersPlaced = Counter.builder("orders.placed")
                .tag("channel", "web")
                .register(registry);
    }

    @PostMapping("/orders")
    ResponseEntity<Void> placeOrder(@RequestBody OrderRequest request) {
        ordersPlaced.increment();
        return ResponseEntity.accepted().build();
    }
}
Add io.micrometer:micrometer-registry-prometheus and set management.endpoints.web.exposure.include=prometheus, and Boot exposes everything at /actuator/prometheus in the Prometheus text exposition format — a stable, documented, plain-text wire format. This is what a request counter and a timer actually look like on the wire, tag values and all:
# HELP orders_placed_total Number of orders placed
# TYPE orders_placed_total counter
orders_placed_total{channel="web",} 3.0
# HELP http_server_requests_seconds
# TYPE http_server_requests_seconds summary
http_server_requests_seconds_count{method="POST",status="202",uri="/orders",} 3
http_server_requests_seconds_sum{method="POST",status="202",uri="/orders",} 0.041
That has been the standard Spring Boot observability story since Boot 2: an actuator dependency, a registry-specific dependency (Prometheus, Datadog, CloudWatch — pick one, or several), and a scrape endpoint. It still works exactly like this in Boot 4. What changed is that Boot 4 adds a genuinely better fourth option next to it — which is where this guide is really headed.
What changed in Spring Boot 4’s observability story
Here is the thing the “Micrometer 2” rumor mill gets wrong, and I want to correct it plainly before going further: Spring Boot 4.0 does not ship Micrometer 2. As of this writing, Micrometer 2 exists only as an early milestone (2.0.0-M2) on the project’s release train; the version Boot 4.0 actually manages is Micrometer 1.16, which the Spring team confirmed directly in their own release announcement. If you read a “Micrometer 2 migration guide” that assumes a GA release, treat it with real suspicion — there is nothing to migrate to yet.
What did change is bigger than a version bump: Boot 4 introduces an official, Spring-team-built starter for OpenTelemetry. Before this, you had three ways to get OTel signals out of a Spring app, and all three had a real downside:
| Approach | How it works | The catch |
|---|---|---|
| OpenTelemetry Java agent | Attach -javaagent:opentelemetry-javaagent.jar, zero code changes, bytecode instrumentation at runtime. | Has to closely match your library versions; breaks GraalVM native-image and Java’s AOT cache; can conflict with other agents. |
| 3rd-party OpenTelemetry Spring Boot starter | OpenTelemetry’s own community starter, auto-instruments common libraries. | OpenTelemetry’s own docs say to prefer the agent instead; the starter pulls in alpha-suffixed dependencies even though the starter itself is marked stable. |
spring-boot-starter-opentelemetry (new in Boot 4.0) | Built by the Spring team; wraps Micrometer’s existing OTLP registry and tracing bridge, selectable on start.spring.io. | Boot 4 only. You still configure export endpoints yourself for production (defaults only work with a local collector). |
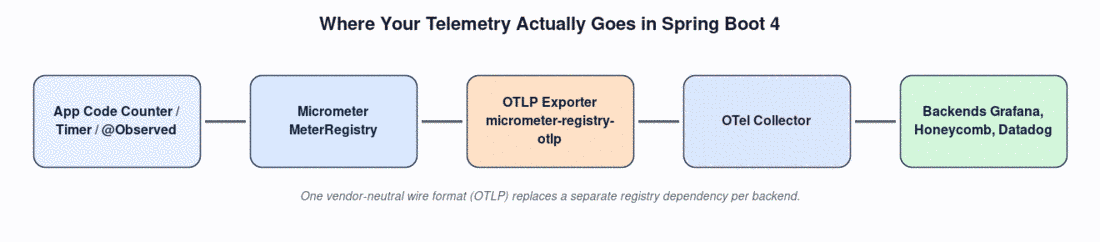
The new starter is not a new metrics API — you still write plain Micrometer Counter/Timer code exactly as in the previous section. What it changes is the export path: instead of a registry-specific dependency like micrometer-registry-prometheus, you get io.micrometer:micrometer-registry-otlp and io.micrometer:micrometer-tracing-bridge-otel bundled together, and everything — metrics and traces — leaves your app in one vendor-neutral wire format: OTLP. One protocol, any OTel-capable backend (Grafana, Honeycomb, Datadog, an open-source collector), no per-vendor registry dependency to swap out later.
That is the actual, current, GA story to migrate toward, and it is the one the rest of this guide covers.
Migrating to the OpenTelemetry starter
With the concepts from the previous section in place, the migration itself is a dependency swap plus a handful of properties. Here is a typical Boot 3-era setup and what replaces it in Boot 4.
Before: actuator + a registry-specific dependency
<dependency>
    <groupId>org.springframework.boot</groupId>
    <artifactId>spring-boot-starter-actuator</artifactId>
</dependency>
<dependency>
    <groupId>io.micrometer</groupId>
    <artifactId>micrometer-registry-prometheus</artifactId>
</dependency>
<dependency>
    <groupId>io.micrometer</groupId>
    <artifactId>micrometer-tracing-bridge-brave</artifactId>
</dependency>
After: one starter
<dependency>
    <groupId>org.springframework.boot</groupId>
    <artifactId>spring-boot-starter-opentelemetry</artifactId>
</dependency>
That single starter pulls in micrometer-registry-otlp for metrics and micrometer-tracing-bridge-otel for traces — you no longer choose a registry per backend, because OTLP is the backend-neutral wire format. It is also selectable directly as “OpenTelemetry” on start.spring.io if you are scaffolding a new project.
Property changes
Metrics and traces now point at OTLP endpoints instead of a scrape path:
# Metrics: where to POST OTLP metrics (default is http://localhost:4318/v1/metrics)
management.otlp.metrics.export.url=http://otel-collector.internal:4318/v1/metrics

# Traces: where to POST OTLP traces
management.opentelemetry.tracing.export.otlp.endpoint=http://otel-collector.internal:4318/v1/traces
Two things caught me off guard the first time I did this migration, and both are worth flagging before you start:
- There is no scrape endpoint to poll anymore. Metrics are pushed from your app to the OTLP endpoint on an interval, not pulled by a Prometheus scraper. If your infrastructure expects to scrape
/actuator/prometheus, you either keep the Prometheus registry alongside the OTel starter, or point your collector to accept OTLP push and convert to Prometheus format downstream. - Local development just works, production does not. If Boot detects a
compose.yamlwith an OTLP-capable image (the Grafana LGTM stack is the example the Spring team ships), it auto-configures the export endpoints for you via Docker Compose service connections. That convenience disappears the moment you deploy anywhere else — you must set both properties above explicitly, or your telemetry silently goes nowhere.
With metrics and traces both flowing over OTLP, the next question is what actually produces a trace span in the first place — which is where Micrometer’s Observation API earns its keep.
The Observation API: one recording, two signals
Everything up to the migration in the previous section assumed you record metrics and traces separately. Micrometer’s Observation API (introduced in Micrometer 1.10, and the mechanism every Spring portfolio project uses internally) lets one piece of instrumentation produce both at once: a timer and a trace span from a single observe() call.
The simplest way in is the @Observed annotation, which needs an ObservationRegistry bean and AOP proxying enabled (Boot’s actuator autoconfiguration wires both up for you when Micrometer Tracing is on the classpath):
@Service
class GreetingService {

    @Observed(name = "say-hello", contextualName = "greeting-service#sayHello")
    String sayHello(String userId) {
        // business logic here
        return "Hello, " + userId;
    }
}
Call sayHello(...) and two things happen from that one annotation: a say-hello timer is recorded in your MeterRegistry (so it shows up at /actuator/prometheus or gets pushed via OTLP, exactly like the counters from earlier), and, if Micrometer Tracing is configured, a trace span named greeting-service#sayHello is created and nested under whatever span was already active — the incoming HTTP request, typically.
For cases you cannot annotate — a block inside a larger method, or logic assembled dynamically — you use the registry programmatically:
@Service
class GreetingService {

    private final ObservationRegistry observationRegistry;

    GreetingService(ObservationRegistry observationRegistry) {
        this.observationRegistry = observationRegistry;
    }

    String sayHello(String userId) {
        return Observation.createNotStarted("say-hello", observationRegistry)
                .lowCardinalityKeyValue("locale", "en-US")
                .observe(() -> "Hello, " + userId);
    }
}
Notice the method name: lowCardinalityKeyValue. Micrometer forces you to be explicit about which key/value pairs are safe to turn into a metric tag (bounded values only) versus which are only safe to attach to a trace span (highCardinalityKeyValue, for things like a full user ID or request URL). That distinction is not bureaucracy — it is the fix for the exact failure mode covered in the cardinality section coming up. The API makes it structurally awkward to accidentally tag a metric with something unbounded.
One recording, a metric and a span, both correctly scoped for cardinality. But a trace is only useful if the context — the trace ID that ties one span to the next — actually survives the trip across threads and services. That is the next failure mode, and it is a common one.
Context propagation gotchas
The @Observed call from the previous section only nests correctly under a parent span if the trace context actually reaches the code that creates it. That context lives in a ThreadLocal, and there are exactly two ways it gets lost: crossing a thread boundary inside your own app, and crossing a network boundary to another service without carrying the trace ID along.
Rule one: never `new` an HTTP client
Boot auto-configures RestTemplateBuilder, RestClient.Builder, and WebClient.Builder with the instrumentation needed to stamp the current trace context into an outgoing request header (following the W3C Trace Context spec). If you write new RestTemplate() or new RestClient() instead of injecting and using the builder, none of that instrumentation is present — the call goes out with no trace header, the next service starts a brand-new trace, and your distributed trace silently splits in two.
// Wrong: the trace context has no way to attach to this instance
RestClient client = RestClient.create();

// Right: the builder Boot gives you is already wired for context propagation
@Service
class UserClient {
    private final RestClient restClient;

    UserClient(RestClient.Builder builder) {
        this.restClient = builder.baseUrl("http://user-service").build();
    }
}
Rule two: async work needs a decorator
@Async methods and anything submitted to an AsyncTaskExecutor run on a different thread, and a plain ThreadLocal does not follow the work there. Register a ContextPropagatingTaskDecorator bean and Boot’s autoconfiguration installs it into the executor for you, so the trace context (and anything else using Micrometer’s Context Propagation API) rides along into the new thread:
@Configuration(proxyBeanMethods = false)
class ContextPropagationConfig {

    @Bean
    ContextPropagatingTaskDecorator contextPropagatingTaskDecorator() {
        return new ContextPropagatingTaskDecorator();
    }
}
Miss this and the symptom is confusing: traces mysteriously lose spans, and log lines from the async thread stop showing a trace ID, even though the synchronous parts of the same request are fully instrumented.
A trick worth stealing: put the trace ID in the response
If you inject a Tracer bean, you can read the current trace ID and echo it back to the caller as a response header. When a user reports “the request failed,” you ask for that header value and go straight to every log line and span for that exact request — no more guessing which of ten thousand requests in the last minute was theirs.
@Component
class TraceIdHeaderFilter extends OncePerRequestFilter {

    private final Tracer tracer;

    TraceIdHeaderFilter(Tracer tracer) {
        this.tracer = tracer;
    }

    @Override
    protected void doFilterInternal(HttpServletRequest request, HttpServletResponse response,
            FilterChain chain) throws ServletException, IOException {
        TraceContext context = tracer.currentTraceContext().context();
        if (context != null) {
            response.setHeader("X-Trace-Id", context.traceId());
        }
        chain.doFilter(request, response);
    }
}
Context that propagates correctly is only half the battle, though. The other half is making sure the metrics you emit don’t quietly bring down the very backend you are relying on to read them — which brings us to cardinality, the failure mode I have personally caused more incidents with than any other.
Cardinality: the silent killer
Back in the first section, I mentioned that every unique combination of a meter’s name and its tags becomes a separate time series. That single sentence is responsible for more 3am pages than any Spring upgrade I have ever done, so it earns its own demonstration rather than just a warning.
Here is the mechanism in isolation — no Micrometer, no Spring, no network, just plain Java, so you can run it yourself in ten seconds and see the effect directly. It mirrors, at a conceptual level, exactly what a real MeterRegistry does internally: use a name-plus-tags key to look up (or create) a series.
import java.util.concurrent.ConcurrentHashMap;
import java.util.Map;
import java.util.Objects;

public class CardinalityDemo {

    // Mimics Meter.Id: a name plus a tag, used as a map key.
    static final class MeterId {
        final String name, tagKey, tagValue;
        MeterId(String name, String tagKey, String tagValue) {
            this.name = name; this.tagKey = tagKey; this.tagValue = tagValue;
        }
        @Override public boolean equals(Object o) {
            if (!(o instanceof MeterId)) return false;
            MeterId other = (MeterId) o;
            return name.equals(other.name) && tagKey.equals(other.tagKey)
                    && tagValue.equals(other.tagValue);
        }
        @Override public int hashCode() { return Objects.hash(name, tagKey, tagValue); }
    }

    // Mimics MeterRegistry: one map entry = one time series in your backend.
    static final Map<MeterId, Long> registry = new ConcurrentHashMap<>();

    static void recordRequest(String userId) {
        // BAD: tagging with a raw, unbounded value instead of a bounded label.
        registry.merge(new MeterId("http.requests", "user.id", userId), 1L, Long::sum);
    }

    public static void main(String[] args) {
        for (int i = 0; i < 100_000; i++) {
            recordRequest("user-" + i);
        }
        System.out.println("Distinct time series created: " + registry.size());

        Map<String, Long> bounded = new ConcurrentHashMap<>();
        for (int i = 0; i < 100_000; i++) {
            bounded.merge("/api/orders", 1L, Long::sum);
        }
        System.out.println("Same requests, tagged with a bounded path label: " + bounded.size());
    }
}
I ran that exact file (java CardinalityDemo.java, Java 11+’s single-file launcher — no build tool needed) to produce this output:
Distinct time series created: 100000
Same requests, tagged with a bounded path label: 1
One hundred thousand requests, tagged with a raw user ID instead of a bounded label, become one hundred thousand separate time series. That is not a Micrometer bug — it is how every dimensional metrics system works, Prometheus and OTLP included, and it is exactly what happens when someone tags a counter with a user ID, an order ID, a session ID, or a full request URL with a query string. The backend either falls over trying to index that many series, or your bill for the observability vendor quietly triples.
The fix is the rule the Observation API tries to nudge you toward in the section above: tags belong to bounded, low-cardinality dimensions — HTTP method, status code, a route template like /orders/{id} rather than the literal URL, a small enum of channel values. Anything with unbounded cardinality (an ID, a timestamp, free text) belongs in a log line or, at most, a trace span attribute — never a metric tag.
Exporting logs over OTLP (the signal Boot doesn’t wire up for you)
Metrics and traces both got easier with the new starter, covered back in the migration section. Logs are the odd one out: Boot’s autoconfiguration sets up the OpenTelemetry SDK’s ability to export logs, but it deliberately does not install a Logback or Log4j2 appender for you — you have to do that part by hand.
First, set the endpoint:
management.opentelemetry.logging.export.otlp.endpoint=http://otel-collector.internal:4318/v1/logsThen add the Logback appender dependency (it ships with an -alpha version suffix — there is currently no stable release of this specific appender, which is worth knowing before a security scanner flags it) and point your logback-spring.xml at it:
<dependency>
    <groupId>io.opentelemetry.instrumentation</groupId>
    <artifactId>opentelemetry-logback-appender-1.0</artifactId>
    <version>2.21.0-alpha</version>
</dependency>
<configuration>
<include resource="org/springframework/boot/logging/logback/base.xml"/>
<appender name="OTEL" class="io.opentelemetry.instrumentation.logback.appender.v1_0.OpenTelemetryAppender" />
<root level="INFO">
<appender-ref ref="CONSOLE"/>
<appender-ref ref="OTEL"/>
</root>
</configuration>And install the appender against Boot’s OpenTelemetry bean on startup:
@Component
class InstallOpenTelemetryAppender implements InitializingBean {

    private final OpenTelemetry openTelemetry;

    InstallOpenTelemetryAppender(OpenTelemetry openTelemetry) {
        this.openTelemetry = openTelemetry;
    }

    @Override
    public void afterPropertiesSet() {
        OpenTelemetryAppender.install(openTelemetry);
    }
}
Do all three and every log line picks up the current trace ID and span ID automatically (Boot adjusts the default log pattern for this the moment Micrometer Tracing is on the classpath), which is what makes “find every log line for this one failed request” actually possible instead of a grep-and-pray exercise.
The migration checklist (in the order I’d do it)
- Confirm you are actually on Spring Boot 4.0+ before reaching for
spring-boot-starter-opentelemetry— it does not exist on Boot 3. - Do not chase a “Micrometer 2” migration. Boot 4.0 manages Micrometer 1.16; 2.0 is still pre-release milestones only.
- Decide whether you still need a scrape endpoint (
/actuator/prometheus). If yes, keepmicrometer-registry-prometheusalongside the new starter rather than replacing it outright. - Swap
micrometer-tracing-bridge-brave(or whichever bridge you used) and any registry-specific dependency forspring-boot-starter-opentelemetry. - Set
management.otlp.metrics.export.urlandmanagement.opentelemetry.tracing.export.otlp.endpointexplicitly for every non-local environment — Docker Compose auto-detection only helps locally. - Grep your codebase for
new RestTemplate(),new RestClient(), andnew WebClient(). Every hand-constructed client is a broken trace waiting to happen. - Register a
ContextPropagatingTaskDecoratorbean if you use@Asyncor a customAsyncTaskExecutoranywhere. - Audit every custom meter tag for cardinality: anything that can take more than a few dozen distinct values (user IDs, order IDs, raw URLs) does not belong as a tag.
- If you need logs correlated by trace ID in your OTel backend, wire up the Logback/Log4j2 appender by hand — Boot does not do this step for you.
- Add the
X-Trace-Idresponse header pattern early; it pays for itself the first time someone reports a one-off failure.
An AI prompt to audit your observability setup
Paste this into Claude, ChatGPT, Gemini, or Cursor with your Spring Boot project in context. It is tuned to the specific pitfalls covered above, not generic “add some metrics” advice.
You are auditing a Spring Boot application's observability setup (metrics,
traces, logs) ahead of or after a Spring Boot 4 upgrade. Scan the project and
produce a prioritised report with file paths and line numbers.

Flag, in this order of severity:
1. CARDINALITY RISK: any Counter/Timer/DistributionSummary tagged with a user
   ID, order ID, session ID, raw request URL, timestamp, or other unbounded
   value. List each occurrence and suggest a bounded replacement tag.
2. BROKEN TRACE PROPAGATION: any `new RestTemplate()`, `new RestClient()`, or
   `new WebClient()` instead of an injected builder; any @Async method or
   custom AsyncTaskExecutor without a ContextPropagatingTaskDecorator bean.
3. STALE DEPENDENCIES: registry-specific dependencies (micrometer-registry-*)
   or tracing bridges (micrometer-tracing-bridge-*) that could be consolidated
   under spring-boot-starter-opentelemetry if the project is on Boot 4+.
   Do NOT recommend a "Micrometer 2" migration -- 2.0 is not GA.
4. MISSING EXPORT CONFIG: OTLP export properties
   (management.otlp.metrics.export.url,
   management.opentelemetry.tracing.export.otlp.endpoint,
   management.opentelemetry.logging.export.otlp.endpoint) that are unset for
   non-local environments.
5. LOG CORRELATION: whether trace/span IDs appear in the log pattern, and
   whether a Logback/Log4j2 OTLP appender is configured if logs need to reach
   the same backend as traces.

For each finding give: file:line, the risk, and the exact replacement code.
End with an ordered migration plan grouped by severity.
Frequently asked questions
Does Spring Boot 4 use Micrometer 2?
No. Spring Boot 4.0 manages Micrometer 1.16. Micrometer 2.0 exists only as an early milestone release (2.0.0-M2) as of this writing, with no GA date announced. Be skeptical of any guide that assumes otherwise.
Is spring-boot-starter-opentelemetry required to use OpenTelemetry with Spring Boot?
No. It is the option the Spring team recommends and built themselves, but you can still attach the OpenTelemetry Java agent for zero-code-change instrumentation, or use OpenTelemetry’s own community Spring Boot starter. The new starter’s advantage is that it is built specifically to work with Boot’s existing Micrometer-based instrumentation rather than adding a second, parallel instrumentation layer.
Do I need to remove micrometer-registry-prometheus to adopt the OpenTelemetry starter?
Not necessarily. If your infrastructure still scrapes /actuator/prometheus, keep that registry alongside spring-boot-starter-opentelemetry. The two are not mutually exclusive — Micrometer can push to multiple registries from the same meters.
What is the single most common mistake in this migration?
Tagging a metric with an unbounded value — a user ID, order ID, or raw URL — instead of a bounded label. It is demonstrated directly in the cardinality section above, and it is the failure mode most likely to actually page someone at 3am.
Why does my trace lose spans when I use @Async?
Trace context lives in a ThreadLocal, which does not follow work onto a new thread by default. Register a ContextPropagatingTaskDecorator bean, covered in context propagation gotchas, and Boot installs it into your async executor automatically.
Does OTLP export work locally without a collector?
Yes, if you use Boot’s Docker Compose service connections with an OTLP-capable image like the Grafana LGTM stack — Boot detects it and auto-configures the export endpoints. In any other environment, including production, you must set the export URL properties yourself.
See also
- Spring Boot 3 to 4 Migration Guide
- Spring Framework 6 to 7 Migration Guide
- Spring Boot 4 HTTP Service Clients
- Virtual Threads vs Reactive (WebFlux) vs Platform Threads in Spring Boot
- Project Leyden: AOT Compilation and Smart Caching
- 10 AI Prompts for Spring Boot Development
Conclusion
Spring Boot 4’s observability rewrite is not the version-number headline it sounds like — there is no Micrometer 2 to chase, and the Micrometer API you already know (Counter, Timer, Gauge, the Observation API) has not changed underneath you. What changed is the export path: spring-boot-starter-opentelemetry gives you one dependency and one wire format, OTLP, instead of a different registry jar per backend. The mechanics that actually cause outages — broken trace propagation from a hand-built HTTP client, lost context across @Async boundaries, and unbounded tags exploding your series count — are exactly the same mechanics they always were, Boot 4 or not. Work through this guide top to bottom once, run the cardinality demo yourself so the failure mode is not just theoretical, and your dashboards will survive the next upgrade better than mine did.
No Comments yet!