
In this post, we implement image thresholding in MATLAB. Thresholding is one of the simplest and most widely used segmentation techniques. It converts a grayscale image into a binary image by comparing each pixel’s intensity against a threshold value: pixels below the threshold are set to 0 (black) and pixels at or above the threshold are set to 255 (white). This cleanly separates foreground objects from the background.
MATLAB Code
% Image Thresholding in MATLAB
% Converts a grayscale image to binary using a user-supplied threshold.
% Pixels below the threshold -> 0 (black)
% Pixels >= threshold       -> 255 (white)

clc;        % Clear the command window
clear all;  % Clear all workspace variables

% --- Load image ---
% Place your image in the MATLAB working directory.
originalImage = imread('sample.jpg');       % Read the colour image
grayImage     = rgb2gray(originalImage);    % Convert to grayscale

imageSize = size(grayImage);  % [rows, cols]

% --- Get threshold from user ---
thresholdValue = input('Enter threshold value (0-255) : ');  % e.g. 128

% --- Apply threshold ---
binaryImage = grayImage;  % Copy to preserve border pixels

for i = 1 : imageSize(1)
    for j = 1 : imageSize(2)
        if grayImage(i, j)  black
        else
            binaryImage(i, j) = 255;  % At or above threshold -> white
        end
    end
end

% --- Display results ---
subplot(1, 2, 1);
imshow(grayImage);
title('Original Grayscale Image');

subplot(1, 2, 2);
imshow(binaryImage);
title(['Thresholded at ', num2str(thresholdValue)]);
How the Code Works
- Image loading — The colour image is read with
imread()and converted to an 8-bit grayscale matrix (values 0–255) usingrgb2gray(). - User threshold —
input()prompts the user to enter an integer between 0 and 255. A value of 128 splits the intensity range exactly in half; lower values produce more white pixels (brighter threshold), higher values produce more black pixels (darker threshold). - Nested loop — Iterates over every pixel in the image. The
ifcondition compares the grayscale value against the threshold and assigns either 0 or 255 to the output pixel, producing a binary (two-level) image. - num2str() — Converts the numeric threshold to a string so it can be embedded in the subplot title, making the figure self-documenting.
- subplot(1, 2, k) — Displays the original and thresholded images side by side for a direct visual comparison.
Sample Input / Output
Enter threshold value (0-255) : 128
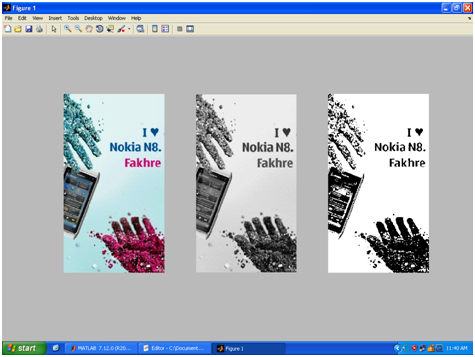
MATLAB opens a figure window showing the original grayscale image on the left and the thresholded binary image on the right, with the title “Thresholded at 128”.
Output Explanation
- Original Grayscale — The input image with the full 0–255 intensity range.
- Thresholded Image — A pure black-and-white image. Every pixel is either 0 (black) or 255 (white). Bright objects in the original (intensity ≥ 128) appear white; dark regions (intensity < 128) appear black. The result segments the image into two regions based solely on brightness.
- Changing the threshold value changes which objects are segmented: a lower threshold (e.g. 64) retains more of the image as white, while a higher threshold (e.g. 200) keeps only the brightest objects.
See Also
- Implementing Edge Detection in MATLAB
- Implementation of Histogram Processing in MATLAB
- Implementing Digital Negative and Grayscale of Image in MATLAB
- Implementing HPF in MATLAB
Conclusion
Thresholding is the most fundamental image segmentation technique. While this program implements it using a simple loop for clarity, MATLAB provides the more concise expression binaryImage = grayImage >= thresholdValue which achieves the same result in a single vectorised line. For automatic threshold selection, MATLAB’s graythresh() function uses Otsu’s method to find the optimal threshold without user input, which is useful when processing large batches of images.
No Comments yet!