
In this blog post, we will explore how to plot basic discrete-time signals in MATLAB, including the Unit Impulse, Unit Step, Unit Ramp, and Exponential Function. These fundamental signals are commonly used in signal processing and control systems.
Below is a MATLAB script that plots these four signals using the stem() function, which is used to display discrete-time signals.
t=-2:1:2;
y=[zeros(1,2), ones(1,1), zeros(1,2)];
subplot(2,2,1);
stem(t,y);
ylabel('d(n)');
xlabel('unit impulse');

n=input('Enter n values');
t=0:1:n-1;
y1=ones(1,n);
subplot(2,2,2);
stem(t,y1);
ylabel('Amplitude');
xlabel('unit step');

n=input('Enter n values');
t=0:1:n-1;
subplot(2,2,3);
stem(t,t);
ylabel('Amplitude');
xlabel('unit ramp');

n=input('Enter length of exponential seq');
t=0:1:n-1;
a=input('Enter a value');
y2=exp(a*t);
subplot(2,2,4);
stem(t,y2);
xlabel('Exponential fun');
ylabel('Amplitude');
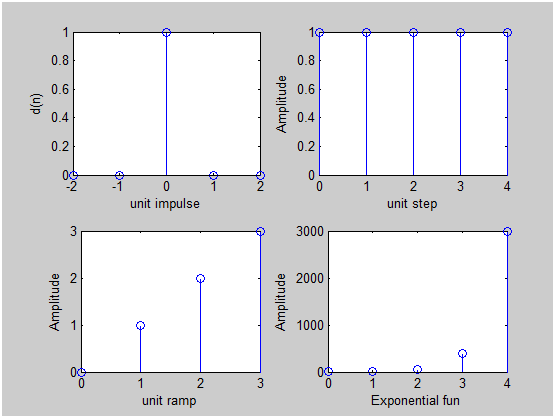
Explanation of the Code
- Unit Impulse Function: Defined at
t = 0, this function has an amplitude of 1 and is zero elsewhere. - Unit Step Function: This function remains at 1 for all
t >= 0. - Unit Ramp Function: This function increases linearly with
t. - Exponential Function: This function follows the formula
y = exp(a*t), whereais user-defined.
Output
Enter n values5
Enter n values4
Enter length of exponential seq5
Enter a value2
After running the script, MATLAB will generate four subplots representing these signals.
These basic signals are crucial in signal processing and control theory. Understanding them will help in analyzing more complex systems.
Hope this helps! Let us know if you have any questions in the comments below.
well explained
The presented way of plotting impulse, step and ramp is completely incorrect. Watch for generating impulse.