
This is a quick tutorial on Hystrix dashboard. Hystrix dashboard allows you to view the overall status of your Spring cloud application at a single glance. It provides access to vital metrics of your application and gives you a graphical representation of those for better understanding.
This post is the continuation of Spring Cloud: Adding Hystrix Circuit Breaker and Spring Cloud: Playing with Hystrix Circuit Breaker. Please go through those post, if you haven’t. Those posts explain about Hystrix circuit breaker.
TL;DR You can download whole project by clicking following link.
Preparing a cloud application for Hystrix Stream
Before we start to consume Hystrix stream, we have to produce it first. To do that we need to add ‘spring-boot-starter-actuator’ dependency in our existing Hystrix based application. We will also need to do some modifications in the configuration file to expose the required endpoints as well.
For this tutorial we will be adding this dependency in application created in Spring Cloud: Adding Hystrix Circuit Breaker.
Updating pom.xml and application.properties
Let’s update our dependencies. We will navigate to pom.xml and will add ‘spring-boot-starter-actuator‘ dependency.
		<dependency>
			<groupId>org.springframework.boot</groupId>
			<artifactId>spring-boot-starter-actuator</artifactId>
		</dependency>
Now open application.properties file and add the following highlighted line. This will enable and expose the required endpoints.
spring.application.name=StudentProducer
eureka.client.serviceUrl.defaultZone=http://localhost:11800/eureka
eureka.instance.instanceId=:
server.port=11801

management.endpoints.web.exposure.include=*
That’s all required at service side.
Creating Hystrix Dashboard Application
Let’s proceed with creating an application which will consume our Hystrix Stream. For that we will be creating a Spring boot application. It will be a Maven Project. We will be creating two files which are as follows:
- AsmHystrixDashboardApplication.java – Spring boot run-able file
- application.properties – Spring properties file
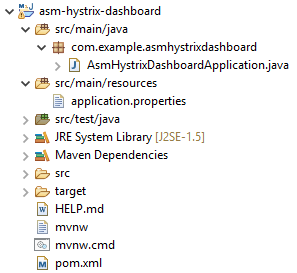
Our project structure is given below.
Adding Dependencies
Let’s add the required dependencies. We will need to add ‘spring-cloud-starter-netflix-hystrix-dashboard‘ dependency in our project.
Replace content in pom.xml file with the following content. Don’t forget to update the project using Maven > Update option. That will download all the necessary dependencies.
<?xml version="1.0" encoding="UTF-8"?>
<project xmlns="http://maven.apache.org/POM/4.0.0" xmlns:xsi="http://www.w3.org/2001/XMLSchema-instance"
	xsi:schemaLocation="http://maven.apache.org/POM/4.0.0 https://maven.apache.org/xsd/maven-4.0.0.xsd">
	<modelVersion>4.0.0</modelVersion>
	<parent>
		<groupId>org.springframework.boot</groupId>
		<artifactId>spring-boot-starter-parent</artifactId>
		<version>2.3.2.RELEASE</version>
		<relativePath/> <!-- lookup parent from repository -->
	</parent>
	<groupId>com.example</groupId>
	<artifactId>asm-hystrix-dashboard</artifactId>
	<version>0.0.1-SNAPSHOT</version>
	<name>asm-hystrix-dashboard</name>
	<description>Demo project for Spring Boot</description>

	<properties>
		<java.version>11</java.version>
		<spring-cloud.version>Hoxton.SR6</spring-cloud.version>
		<maven-jar-plugin.version>3.1.1</maven-jar-plugin.version>
	</properties>

	<dependencies>
		<dependency>
			<groupId>org.springframework.cloud</groupId>
			<artifactId>spring-cloud-starter-netflix-hystrix-dashboard</artifactId>
		</dependency>

		<dependency>
			<groupId>org.springframework.boot</groupId>
			<artifactId>spring-boot-starter-test</artifactId>
			<scope>test</scope>
			<exclusions>
				<exclusion>
					<groupId>org.junit.vintage</groupId>
					<artifactId>junit-vintage-engine</artifactId>
				</exclusion>
			</exclusions>
		</dependency>
	</dependencies>

	<dependencyManagement>
		<dependencies>
			<dependency>
				<groupId>org.springframework.cloud</groupId>
				<artifactId>spring-cloud-dependencies</artifactId>
				<version>${spring-cloud.version}</version>
				<type>pom</type>
				<scope>import</scope>
			</dependency>
		</dependencies>
	</dependencyManagement>

	<build>
		<plugins>
			<plugin>
				<groupId>org.springframework.boot</groupId>
				<artifactId>spring-boot-maven-plugin</artifactId>
			</plugin>
		</plugins>
	</build>

</project>
Creating a Spring Boot Application
Create file AsmHystrixDashboardApplication.java and add the following content. This file will serve as the entry point for our application.
package com.example.asmhystrixdashboard;

import org.springframework.boot.SpringApplication;
import org.springframework.boot.autoconfigure.SpringBootApplication;
import org.springframework.cloud.netflix.hystrix.dashboard.EnableHystrixDashboard;

@SpringBootApplication
@EnableHystrixDashboard
public class AsmHystrixDashboardApplication {

	public static void main(String[] args) {
		SpringApplication.run(AsmHystrixDashboardApplication.class, args);
	}

}
If you have noticed, we have added @EnableHystrixDashboard annotation on our class. This will enable the Hystrix dashboard functionality.
Adding Properties
Under resources folder create a file with name application.properties and add the following content.
spring.application.name=HystrixDashboard
eureka.client.serviceUrl.defaultZone=http://localhost:11800/eureka
eureka.instance.instanceId=:
server.port=11803

management.endpoints.web.exposure.include=*
You must be quite familiar with those properties. We are using those in nearly every project.
Seeing it in action…
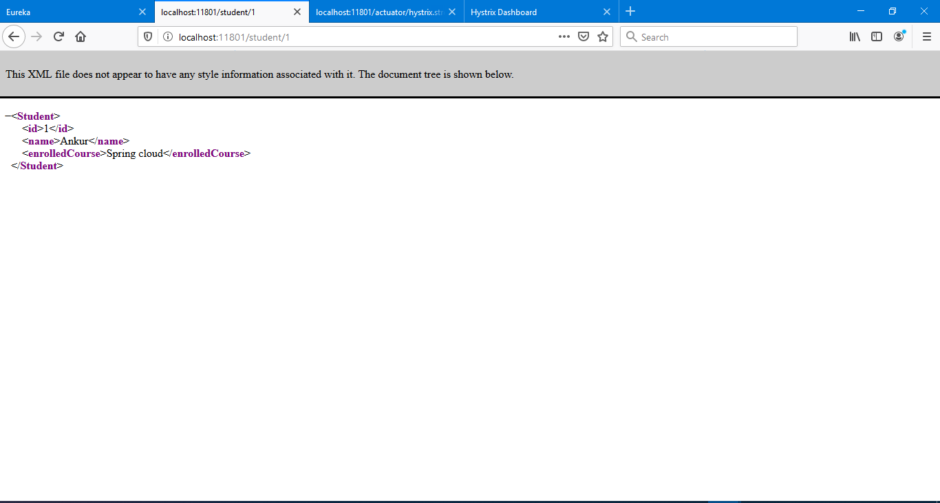
That’s all. Now start Eureka server and AsmHystrixProducerApplication. Start AsmHystrixDashboardApplication as well. Let’s navigate to ‘http://localhost:11801/student/1’ in the browser and you should see some response as shown below. If you receive a response, it means you have configured everything correctly.
In this step, we have verified if our producer/service is running correctly or not.
Now let’s navigate to our Hystrix dashboard. For that, you will need to navigate to ‘http://localhost:11803/hystrix’ and you should see UI as shown below.
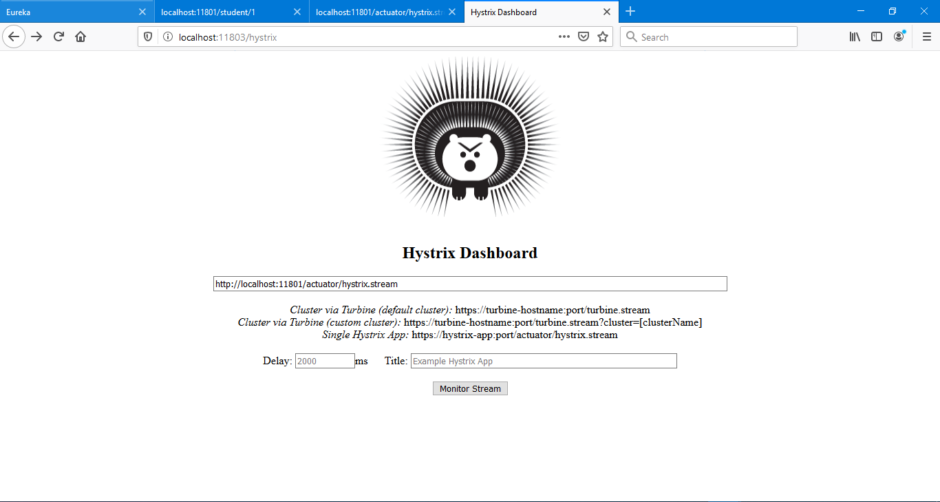
On this UI you will need to mention which service you want to monitor. Here we will be monitoring our student service hence I have mentioned it’s detail over there. Since we have added actuators in our application, it will automatically generate Hystrix stream for us. We will need to mention it in our dashboard application.
So type ‘http://localhost:11801/actuator/hystrix.stream’ in the first input box and click on Monitor Stream. You should start seeing some graphs with vital information about your application as shown in below screenshot.
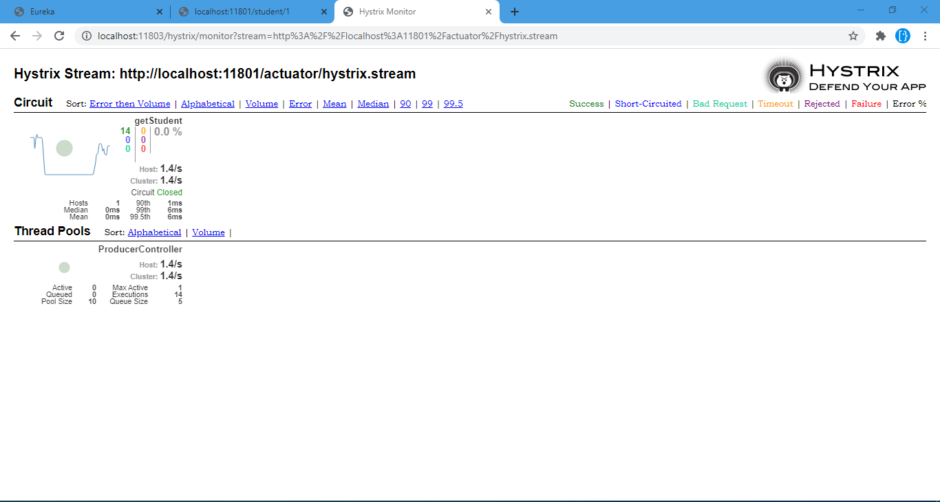
That’s all.
Downloads: